CONTINGENCY TABLE ANALYSIS
|
Subtopics
|
|
There’s a lot that a contingency table can tell you, if you know the right questions to ask. At this point we will focus on describing how strong the relationship is in table.
Measures of association
In this topic, we will deal with measures of association between two variables calculated in conjunction with a contingency table. Elsewhere, we discuss measures of association used when comparing means and in doing regression analysis.
As already noted, statistical significance means only that we can confidently infer that there is some degree of relationship between our variables in the population from which the sample was drawn. We would also like to know how strong the relationship is in the sample. With population data we do not need to worry about statistical significance (since we are dealing directly with the entire population, we don’t need to worry about inferring something about the population based on a sample), but we would still like to know how strong the relationship is. Assessing the strength of a relationship is where measures of association come in.
The best way to determine whether a relationship in a table is strong or weak is to examine the table itself. If the percentage differences among categories of the independent variable seem important, they probably are. Just how big the differences need to be to be considered important will vary with the research questions you are asking. A difference of 10 percentage points is not very dramatic, but in a two-candidate political campaign it could spell the difference between a comfortable 55 to 45 percent win and a decidedly uncomfortable defeat by the same margin.
Still, measures of association between variables are a useful way to summarize the strength of a relationship. This is especially true if you are running a large number of crosstabulations and need a convenient way of sorting out the results to determine which relationships are most important.
In general, measures of association range in value from 0 (indicating no relationship), to ±1 (indicating a perfect relationship). Some measures appropriate for use with nominal data range from 0 to a number approaching, but never reaching, 1. Measures appropriate with nominal data are always positive (since direction has no meaning with nominal data), while those appropriate for use with ordinal data or higher may be either positive or negative. The strength of the relationship is indicated by the absolute value of the measure, not its sign. An association of -.7 is much stronger than one of +.2. Moreover, the sign of the relationship may simply be an artifact of the way we have coded the data. For example, if ideology is coded on a scale from 1 to 5, it is entirely arbitrary whether the higher numbers are associated with liberalism or with conservatism.
Most measures of association are “symmetric.” This means that the value of the measure is the same whichever variable is considered to be the dependent variable. Some measures are “asymmetric.” The measure will have one value if the row variable is the dependent variable, and another if the column variable is dependent.
Some, but not all, measures of association have a “Proportional Reduction in Error” (PRE) interpretation. Basically, such measures indicate how much knowing the value of the independent variable improves our ability to guess the value of the dependent variable. More formally, PRE measures employ the following general formula:
![]()
where ![]() represents
the errors we will make guessing the value of the dependent
variable if we do not know the value of the independent
variable, and
represents
the errors we will make guessing the value of the dependent
variable if we do not know the value of the independent
variable, and ![]() represents
the errors we will make guessing the value of the dependent
variable if we do know the value of the independent
variable. If two variables are
completely unrelated, then
represents
the errors we will make guessing the value of the dependent
variable if we do know the value of the independent
variable. If two variables are
completely unrelated, then ![]() will
be no less than
will
be no less than ![]() ,
and the PRE will be 0. If two variables
are perfectly related, then
,
and the PRE will be 0. If two variables
are perfectly related, then ![]() will
be 0, and the PRE will be 1. A PRE of,
for instance, .25 would indicate a 25 percent reduction in
error.
will
be 0, and the PRE will be 1. A PRE of,
for instance, .25 would indicate a 25 percent reduction in
error.
A non-PRE measure has no such interpretation. All we can say about its value is that the further away from zero (in either direction) it is, the stronger the relationship.
Some writers have suggested various rules of thumb for thresholds between weak, moderate, and strong relationships. All such rules are fairly arbitrary. In general, you can expect that measures of association will tend to be higher when higher levels of measurement are used. In addition, individual data (such as from an opinion survey) will tend to produce measures of association with more modest values than those obtained from aggregate data (such as data from a census, or from election returns by county). This is because individual data will often contain a lot of “noise” variance (for example, even though party identification is generally a good predictor of how people vote, you may vote for a member of another party because the two of you went to the same high school) that tends to be filtered out when data are aggregated.
The most important factor in deciding which of the many available measures of association to use is the level of measurement of your variables. In the remainder of this topic, we will briefly describe the various measures of association produced by the SPSS Crosstabs procedure for nominal and ordinal data. In order to use any of the ordinal measures, both variables must be at least ordinal level. If either or both are nominal, you will have to use a nominal measure.
One measure of association that can be used when one or both variables are nominal level is lambda (λ). This measure has, as we will see, some severe limitations, but is easy to compute, and is useful for illustrating how PRE measures work.
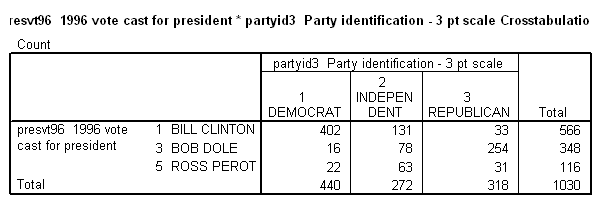
In the National Election Study’s pre-election 2000 survey, respondents were asked to recall how they had voted in the 1996 presidential election. Table 3 compares the recollections of Democrats, Independents, and Republicans in order to test the hypothesis that the way people vote is influenced by their party identification. (Note that numbers are raw cell counts, not percentages.[2] Data are again weighted by the "sample weight" variable." We will take this matter up later in the term)
 |
 |
While party identification might be considered an ordinal
measure, voting choice is clearly nominal, and so a nominal
measure of association is required. If
you knew nothing about a person other than that he or she
was one of the respondents included in the table, your best
guess as to how the respondent voted would be made by
picking the modal response. In other
words, you would guess that the respondent voted for ![]() .
.
If
you know the person’s party identification, you will still
guess that the respondent voted for ![]() .
.
Entering ![]() and
and
![]() into
the general PRE formula, we obtain:
into
the general PRE formula, we obtain:
λ =
![]() =
=![]() =
.476.
=
.476.
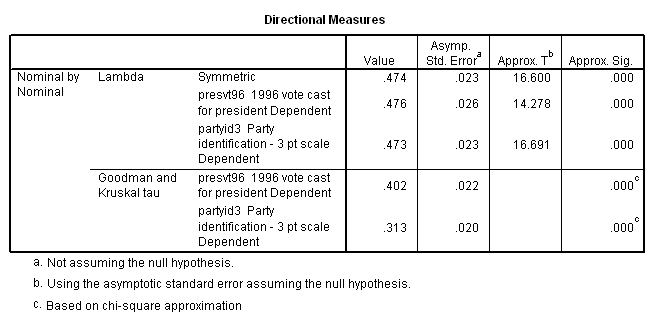
In other words, by knowing a respondent’s party identification, we are able to realize a proportional reduction in error of 48 percent.
(Lambda is an asymmetric measure. Since SPSS does not know which variable we wish to treat as dependent, it calculates the measure both ways. Be sure to use the measure appropriate to your hypothesis. Ignore the "symmetric" lambda.)
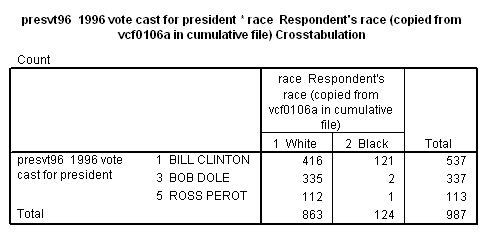
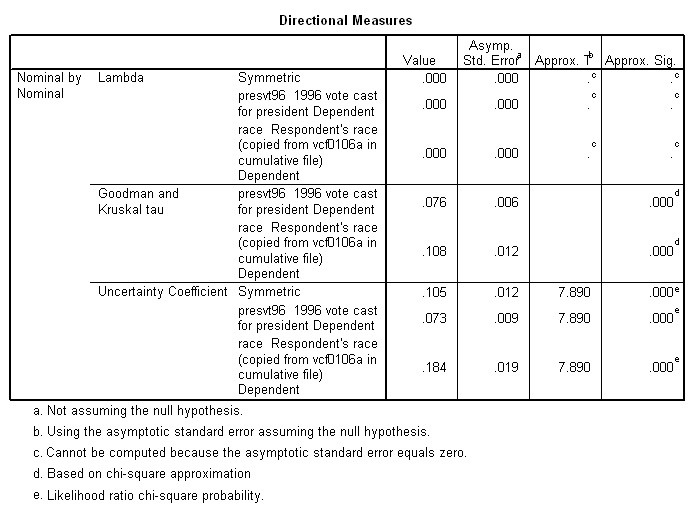
Often lambda severely understates the strength of a relationship. Consider the following, taken from the same survey (and using the same "sample weight"), in which the votes of black and white respondents are compared.
 |
 |
 |
There is obviously a big difference in the voting of black
and white respondents. Blacks were
nearly unanimous in their support of
The Goodman and Kruskal tau (τ) and the uncertainty coefficient are generally similar to lambda, and suffer from the same tendency to understate the strength of relationships, though not to the same degree.
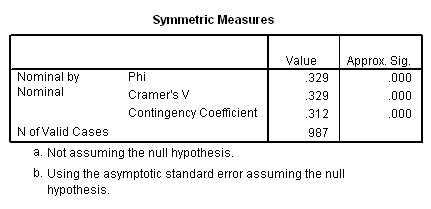
Another approach to measuring the strength of a relationship with nominal data is to standardize chi-square so that, regardless of the sample size, it ranges from 0 to a number approaching 1. Cramer’s V, called phi (φ) in the case of 2 X 2 tables, and the contingency coefficient are both chi-square based measures. The maximum possible value of the contingency coefficient depends on the number of cells in the table, which makes it difficult to compare results for tables of different size. Remember that these chi-square based measures do not have a PRE interpretation. All you can say in interpreting your results is that the higher the value, the stronger the relationship.
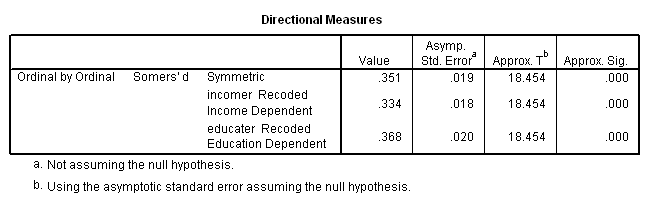
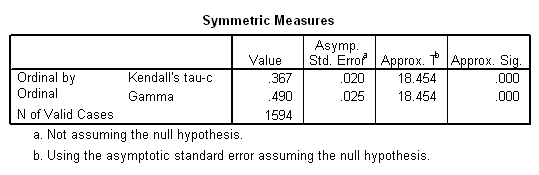
A measure of association that can be used when both variables are ordinal level is gamma (γ). The basic notion behind gamma is that, in a contingency table, if one case has a higher value than another on one variable, it will have a higher value on the other if there is a positive relationship between the variables, and will have a lower value on the other if there is a negative relationship.
When one case has a higher value than another case on both variables, the cases are said to form a “concordant” pair. (Concordant literally means “singing together.”) When one case has a higher value than another on one variable, but a lower value on another, the cases are said to form a “discordant” pair. The formula for gamma is:
![]()
where C is the total number of concordant pairs, and D is the total number of discordant pairs.
If all pairs are concordant, then gamma will equal 1; if they are all discordant, it will equal -1; if there are equal numbers of concordant and discordant pairs, it will equal 0.
Consider the relationship between education and income. While you are no doubt in college primarily to gain increased wisdom, you may also hope that more education will increase your future earning capacity. In other words, you hypothesize that there is a positive relationship between education and income. The following table shows the relationship between these two variables for respondents to the 2000 American National Election Study. (As in the preceding tables, cell entries are raw counts, and data are weighted by "sample weight".)
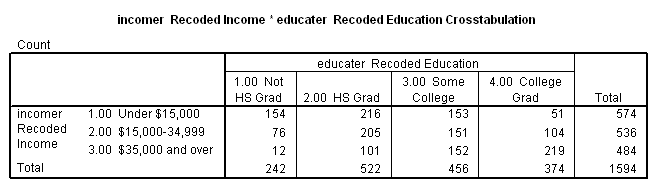 |
 |
 |
Each of the 154 cases in row 1, column 1 forms a concordant pair with each case in the six cells below and to the right of that cell. Similarly, each of the 216 cases in row 1, column 2 forms a concordant pair with each case in the four cells below and to the right of it. The total number of concordant cells is calculated by taking each cell, multiplying the number of cases in the cell with the total number of cases, if any, in cells below and to the right of the cell, and then summing the results. Discordant pairs are calculated in a similar manner, except that each cell is paired with cells below and to its left. Completing this admittedly tedious process (were it done manually) produces the following results:
![]()
![]()
The absolute value (that is, ignoring the sign[3]) of the coefficient has a PRE interpretation. It tells us, as a proportion of the total number of pairs, how many more correct than incorrect guesses we make in guessing whether a pair of cases is concordant or discordant if we know knowing which case has the higher value for the independent variable. The hypothesis that education and income are positively related leads us to guess that if person A has more education than person B, he or she will also have a higher income. In other words, we guess than pairs will be concordant. There are, in fact, 311,239 more concordant than discordant pairs, which is about 49 percent of the total. (Of course, this assumes that you started out with the correct hypothesis. If you had hypothesized that education creates a trained incapacity for earning money, you would have predicted that pairs would be discordant, and would have made 311,239 more incorrect than correct guesses.)
Just as lambda has some shortcomings, so too does gamma. Notice that it ignores ties The 154 cases in row 1, column 1, for example, are tied with each other on both variables, with the other cases in column 1 on education, and with other cases in row 1 on income. Gamma simply ignores these. Other measures have been devised which correct for ties.
One
is
A similar measure, though probably less widely used than Kendall's tau, is called Somers’ d.
Which Measures of Association Should You Use?
In picking the best
measure of association to use, first ask yourself what level
of measurement you’re dealing with. If
one or both variables are nominal, use Cramer’s V unless
your instructor tells you otherwise. If
both are ordinal (again, unless directed differently by your
instructor) use
(In SPSS, if you ask for
Cramer’s V or for
Exercises:
Start SPSS. Open the “anes00s.sav” file and the 2000 American National Election Study Subset codebook. Construct contingency tables to test some of the hypotheses you generated in the exercises for the Political Science as a Social Science topic. Ask for appropriate measures of association. SPSS will automatically calculate the statistical significance of the association.
Note: In some cases, you may need to combine categories of one or more variables before running crosstabulations. See recode and compute for more information.
For Further Study
Becker, Lee A., “CROSSTABS: Measures for Nominal Data,” http://web.uccs.edu/lbecker/SPSS/ctabs1.htm, sections 10 and 11.
Becker, Lee A., “CROSSTABS: Measures for Ordinal Data,” http://web.uccs.edu/lbecker/SPSS/ctabs2.htm, sections 5 and 6.
Creative Research Systems,” Statistical Significance,” The Survey Research System: Your Complete Software Solution for Survey Research. http//www.surveysystem.com/signif.htm.
Lane, David M., “Chapter 16: Chi-Square,” HyperStat Textbook Online. http://davidmlane.com/hyperstat/chi_square.html.