STANDARD SCORES AND THE NORMAL DISTRIBUTION
|
Subtopics
|
|
Introduction
There is an old saying that “you can’t compare apples and oranges.” Fortunately, this is not always the case. Any interval or ratio variable can be converted to a standard unit of measurement called a standard score. This is especially convenient whenever variables are “normally distributed.”
Standard (z) scores
Examine the variables descriptions in the codebook for the countries data. Notice that different variables are measured in radically different units of measurement including, among other things, dollars, people, kilowatt hours, and percentages. Fortunately, any interval or ratio variable can easily be converted to a standard (z) score which, by definition, will have a mean of 0 and a standard deviation of 1 regardless of the original unit of measurement. The formula for converting raw scores on any variable X to z scores is:
![]() ,
where:
,
where:
zi is the standard score for case i,
Xi is the raw score for case i,
μ is the mean of the variable, and
σ is the standard deviation of the variable.
The Normal Distribution
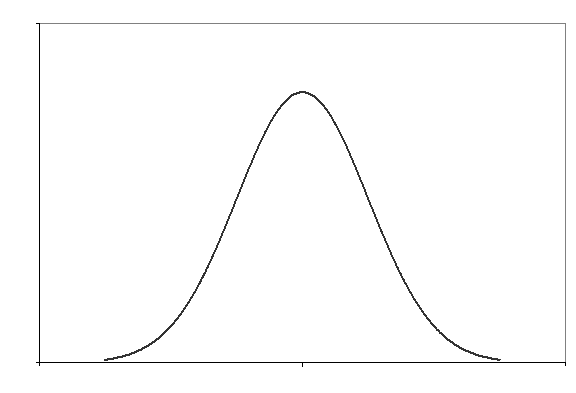
Many variables are “normally distributed.” A typical curve of the normal distribution is shown in the figure below,[1]. (A normal curve is sometimes called a “bell-shaped” curve.) Normal curves have certain defining characteristics. The most frequent values are found in the middle of the distribution, and taper off the further away one goes from the middle. The distribution is symmetric, meaning that the upper half of the distribution is a mirror image of the lower half. Taken together, the result is that the mean, median, and mode are all the same.
While many variables
are normally distributed, many are not. An easy way to
tell if a variable is at least more or less normally distributed is to
construct a histogram of the variable, and compare the result to a normal
curve. The next figure shows the distribution of voter
turnout among
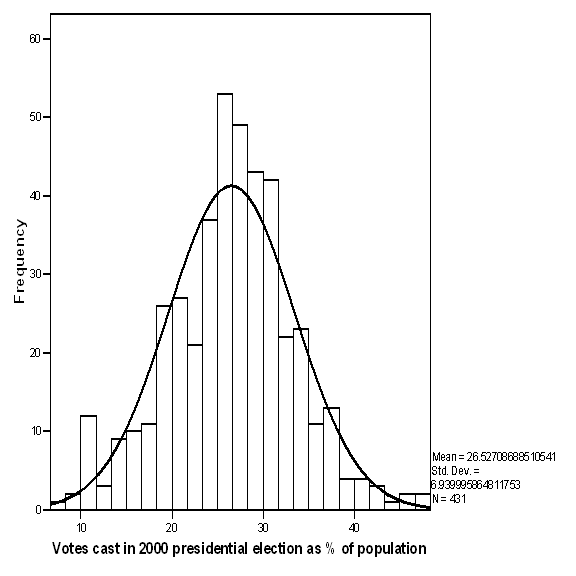 |
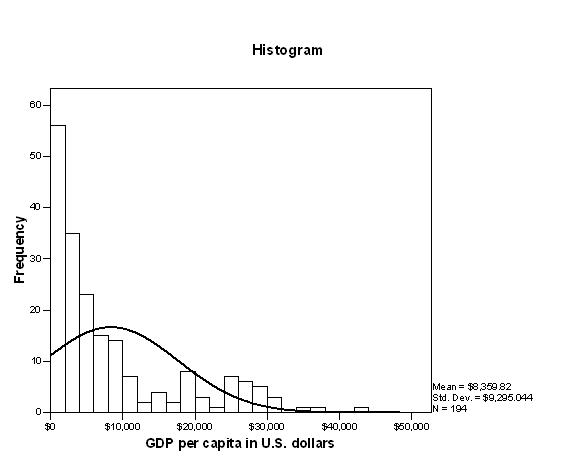
Consider, on the other hand, the per capita gross domestic product of the world’s nations, shown in the figure that follows. Because there are a few very wealthy countries, and many poor ones, the distribution is not even close to forming a normal curve.
|
There are other ways to examine a variable in order to determine whether it is normally distributed. A boxplot provides another tool. If a variable is normally distributed, the median (the 50th percentile) will be midway in the inter-quartile range (the range between the 25th and 75th percentiles), the length of the top and bottom “whiskers” above and below the box will be about the same, and there will be few if any outliers or extreme values beyond the whiskers. There are also a couple of descriptive statistics that help measure departures from the normal distribution. Skewness measures departures from normality due to the impact of very high or very low values. In a perfectly normal distribution, it will have the value 0. If the mean is higher than the median (because the mean is inflated by some very high values), a distribution will have a positive skew. If the reverse is the case (due to some extremely low values), the skew will be negative. Kurtosis measures “peakedness,” the tendency of values to cluster near the middle of the distribution. In a perfectly normal distribution, it will have the value 0. A positive kurtosis indicates that values are more closely clustered toward the middle than would be the case in a normal distribution, while a negative kurtosis indicates that values are more spread out.
Many statistical techniques that require at least interval level measurement also require that variables be normally distributed. It is a good idea, therefore, to begin data analysis with some exploratory research into the distribution of the variables in the dataset. Considerable caution should be exercised in analyzing variables with markedly non-normal distributions.
If variables are normally distributed, standard scores become extremely useful. It turns out that, in a normal distribution, 68 percent of cases will be within one standard deviation of the mean (that is, will have a z score within the range of ±1), 95 percent will be within two standard deviations of the mean, and 99.7 percent will be within 3 standard deviations of the mean. In fact, if a variable is normally distributed, you can, by converting raw scores to z scores:
- convert a score to a percentile (a score in, for example, the 90th percentile would be one for which 90 percent of cases had that score or lower).
- determine the probability that a case will be above or below a certain number, or between two numbers.
Most statistics texts include a “table of the normal distribution” for these purposes. There are also “applets” (little applications) on the Internet that do the same thing. (See exercise 6 below.)
Exercises
Note: In SPSS, histograms can be produced using either the frequencies or the explore procedure. There is also a separate procedure specifically designed to produce histograms. Except for the explore procedure, these include the option of superimposing a normal curve on the histogram. Skewness and kurtosis can be produced with frequencies, descriptives, or explore. Z-scores can be produced with descriptives or compute.
1. Start SPSS, and open “countries.sav.” Look at the countries codebook. Calculate the means and standard deviations for any two interval or ratio variables. Now compute two new variables by converting each of the original variables to z scores. For the new variables, calculate means and standard deviations.
2. Pick several variables in the Countries file, and obtain histograms, comparing the results to a normal distribution. Are the variables at least roughly normally distributed? Why or why not?
3. Go to http://psych.colorado.edu/%7Emcclella/java/normal/normz.html or to http://faculty.vassar.edu/lowry/tabs.html#z and, using the applet found there, answer the following questions about a normally distributed variable with a mean of 50 and a standard deviation of 10:
1. What is the z score for a raw score of 72?
2. What percent of cases will have scores over 72?
3. What percent of cases will have scores between 28 and 72?
For Further Study
Brown, James Dean, “Skewness and Kurtosis,” The JALT Testing & Evaluation SIG Newsletter. April 1997. http://www.jalt.org/test/bro_1.htm.
Lane, David M., “What is a Normal Distribution?” Hyperstat. http://davidmlane.com/hyperstat/normal_distribution.html.
“Normal Distribution,” Surfstat. http://www.anu.edu.au/nceph/surfstat/surfstat-home/surfstat.html.
PQ Systems, “Histogram: Calculate Descriptive Statistics,” Qualityadvisor.com. http://www.qualityadvisor.com/sqc/interpretation/histogram_stats.htm.