COMPARING MEANS
| Subtopics |
Introduction
Just as it is possible to calculate a mean of an entire set of cases for an interval or ratio variable, it is also possible to break the cases into two or more groups and to compare the different group means. If we think of group membership as an independent variable, and the interval or ratio variable as a dependent variable, we might then ask how strong an indicator group membership is of the value of the dependent variable. We can answer this question by calculating a proportional reduction in error measure called eta2 (η2).
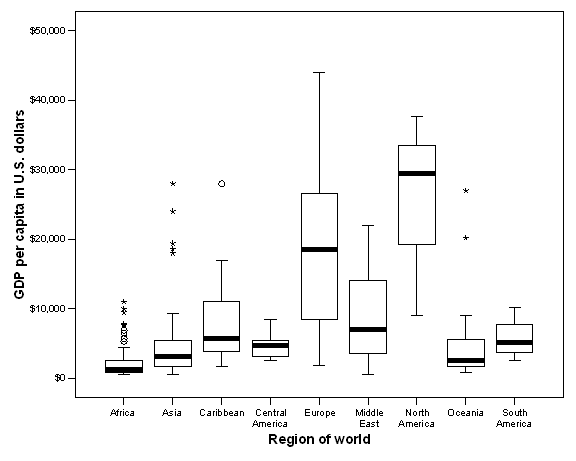
We will illustrate these ideas by comparing the Gross Domestic Product per capita of countries in different regions of the world. Boxplots displaying this relationship are displayed in the following figure:
 |
Analysis of Variance and Eta2 (η2)
Obviously, there are major wealth differences between regions, with North America and Europe clearly the most affluent. At the same time, there are important differences within some regions. European and North American counties vary considerably in their wealth. While most Asian countries are poor, there are a few outliers in this region that are as affluent as most in Europe and North America. But just how good a predictor is region of wealth? Put another way, how much of the variance in wealth is between region, and how much is within region?
We can address this question by carrying out a simple analysis of variance. For an interval or ratio variable, our best guess as to the score of an individual case, if we knew nothing else about that case, would be the mean. The variance gives us a measure of the error we make in guessing the mean, since the greater the variance, the less reliable a predictor the mean will be. For GDP per capita, we obtain the following parameters for all countries taken together:
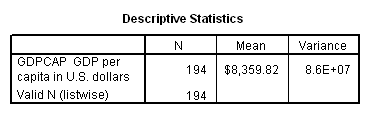
Note: Because it is such a large number, the variance is written in scientific notation. In the SPSS output window, you can find the exact number by double-clicking on the number as written in scientific notation. In this case, that number is 86,397,842.06573.
How much less will our error be in guessing the value of the dependent variable (in this case, GDP per capita) if we know the value of the independent variable (region)? We can calculate the within-group variance in the same way as total variance is calculated, except that, instead of subtracting each score from the overall mean, we subtract it from the group mean. We can then determine how much less variance there is about the group means than about the overall mean.
The formula:
![]() =(total variance — within-group variance)/total variance
=(total variance — within-group variance)/total variance
provides us with the familiar proportional reduction in error.
Eta2 thus belongs to the same “PRE” family of measures as
Lambda, Goodman and Kruskal's tau, the uncertainty coefficient, Gamma,
|
|
 |
Recall that variance is the sum of squared deviations from the mean divided by N (the number of cases). The “Sum of Squares” numbers in the ANOVA table refers to the sum of squared deviations from the mean. (These numbers have been converted from scientific notation.) They are, in other words, the same as the between groups, within groups, and total variances, except that they have not been divided by N. Since N is the same for each, we can omit this last step. Eta2 is then calculated as follows:
![]()
In other words, by knowing the region in which a country is located we can reduce the error we make in guessing its GDP/capita by about 43 percent.
We can also perform a test for the statistical significance of this measure. This test is called the “F ratio,” and is similar in concept to chi square and the t-test.
Exercises
1. Go to the 2004CES questionnaire and data. Select some variables that you think might help explain respondents’ scores on the several “feeling thermometers” included, and do comparison of means tests, requesting ANOVA and eta